Fleet management dashboard: your indicators with their targets
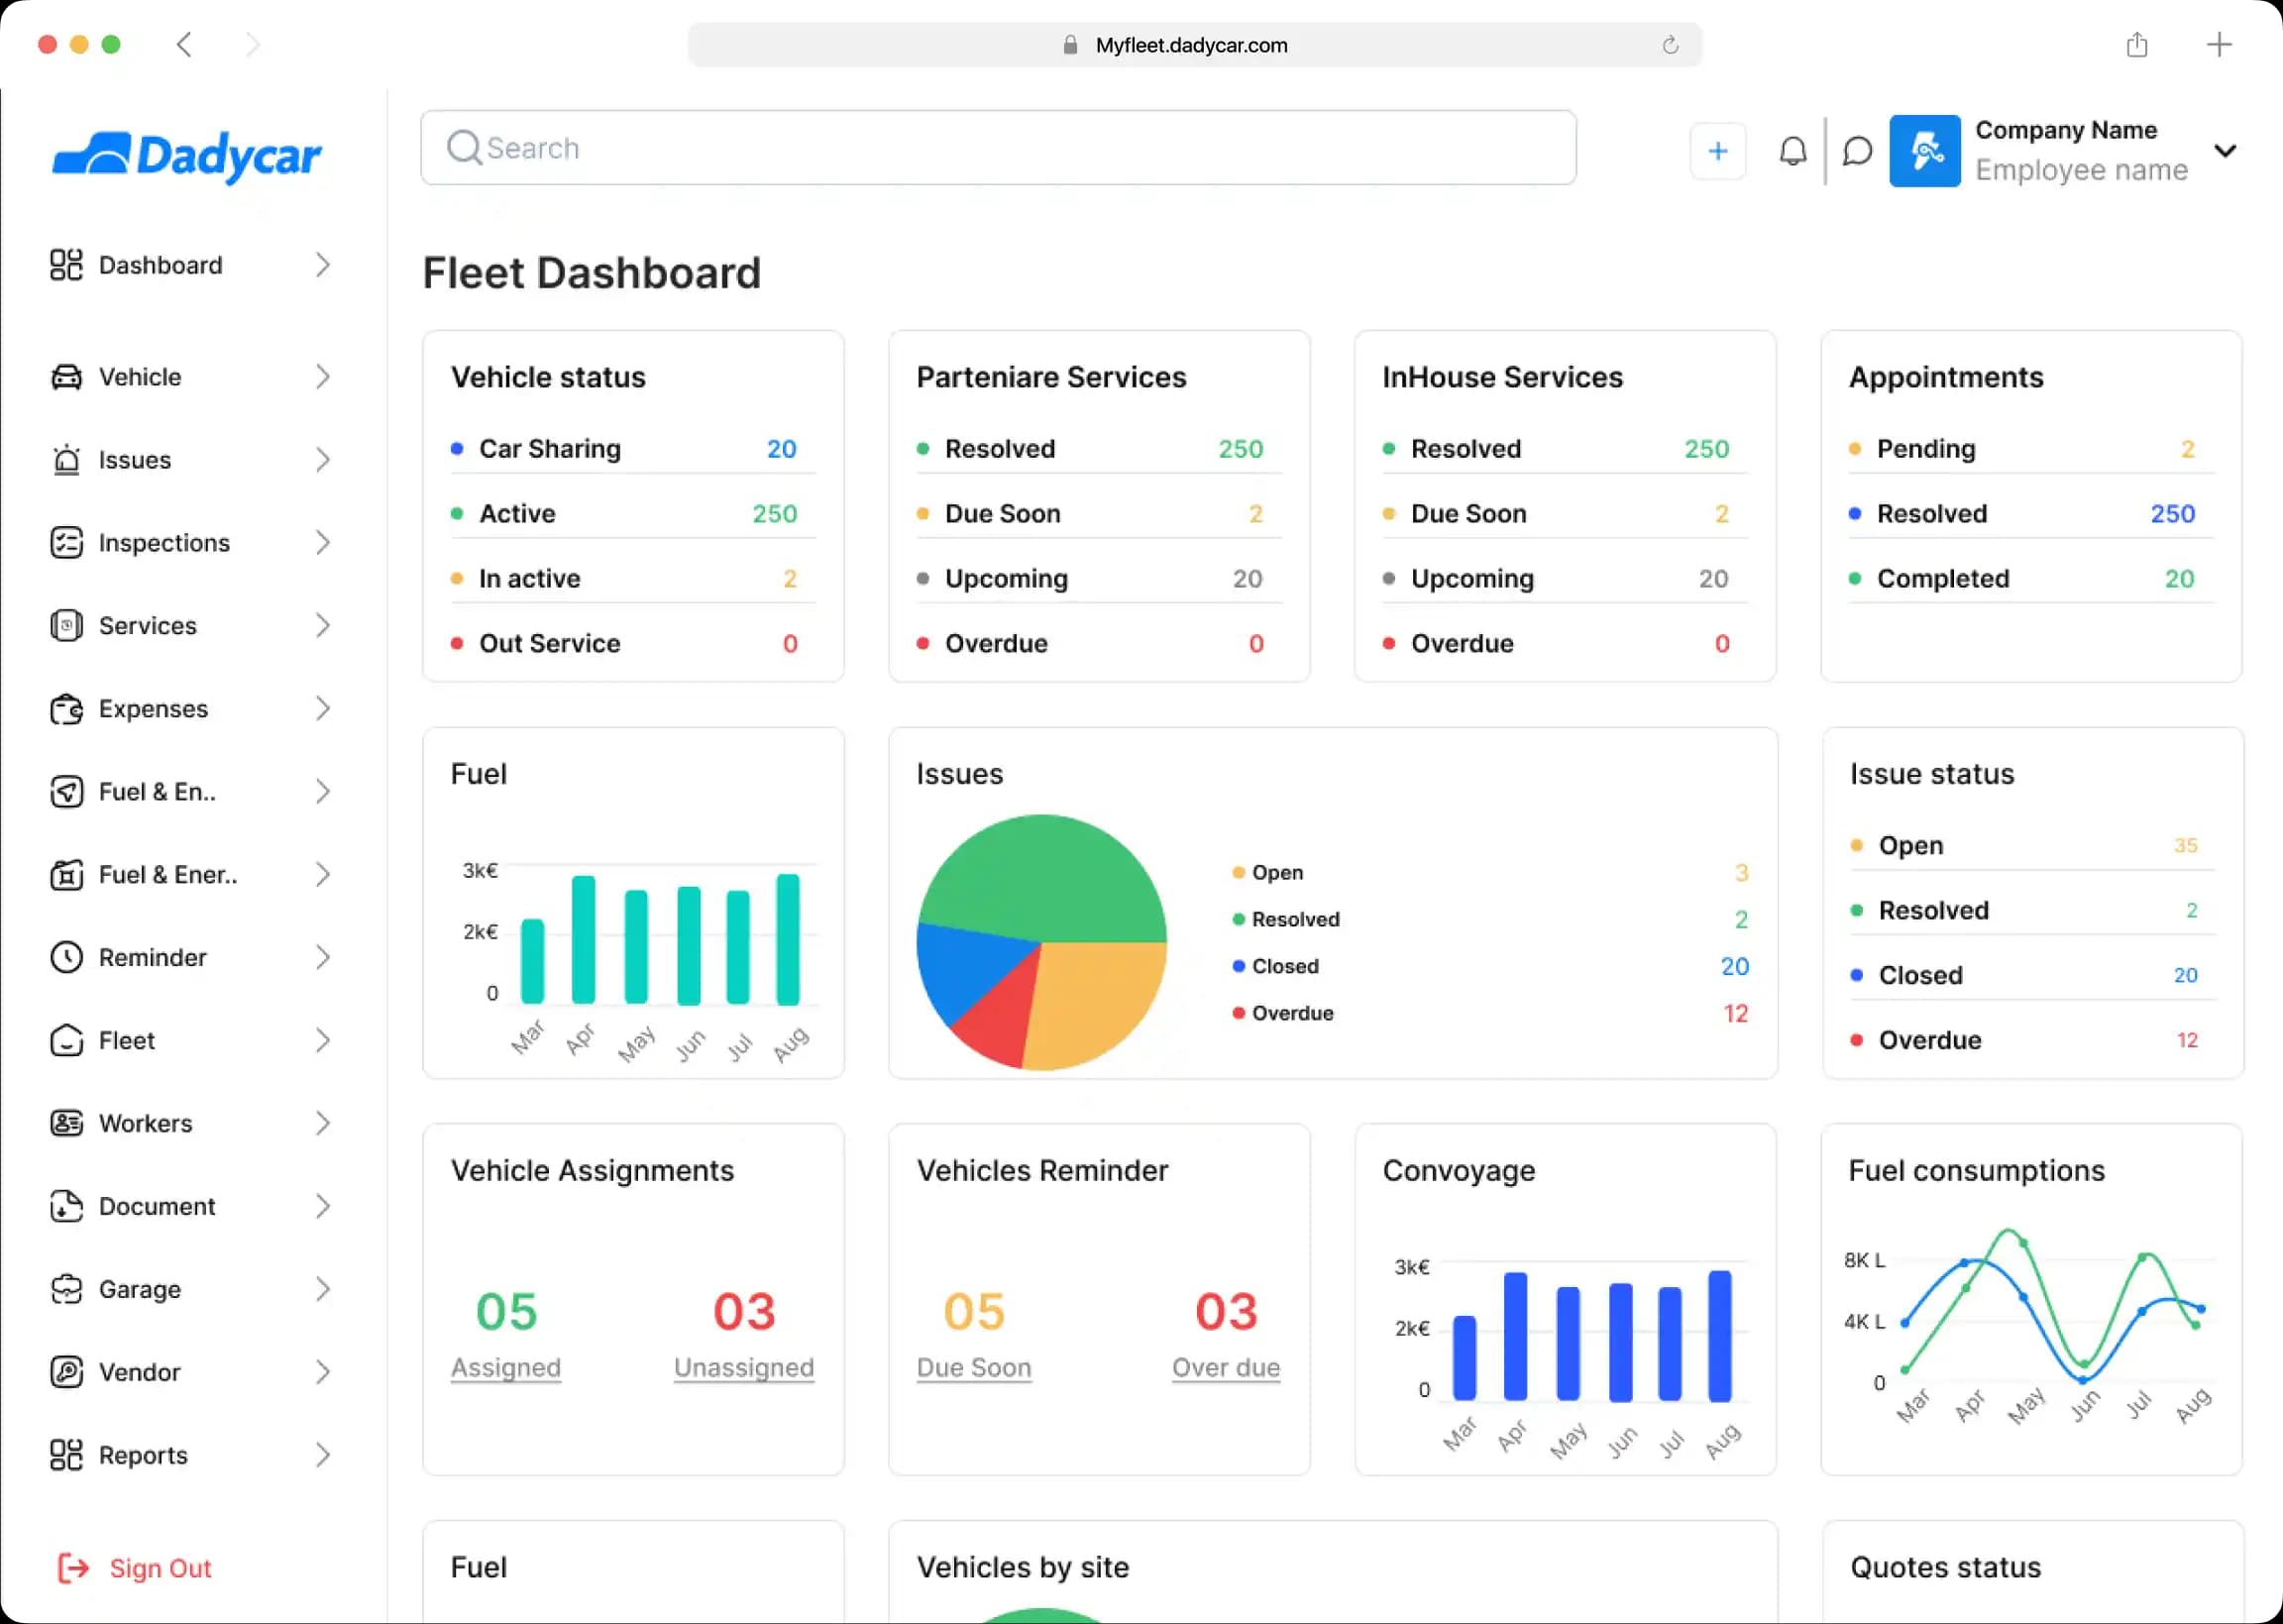
Availability, TCO per vehicle, compliance, vehicles off the road, car sharing: ten tabs, one target per indicator, one filter by site and by period.
Hosted in the European Union · GDPR · Flotauto 2025 Innovation Award · free up to 50 vehicles, then €6 excl. VAT per vehicle per month
The dashboard in three facts
- Ten tabs: overview, fleet, telematics, maintenance, fuel, expenses, cost allocation, compliance, accidents, ESG sustainability.
- One target per indicator: every KPI is shown against its objective, for example fleet availability to be kept above 95 %.
- Up to -70 % of the time spent producing reports: the figures are already there, filtered and exportable.
When the fleet figures arrive too late
- The TCO is calculated once a year, in a spreadsheet, once the renewal decisions have already been made.
- Vehicles off the road are counted by hand, site by site, whenever management asks.
- Compliance is discovered during an inspection: an expired document, an overdue roadworthiness test, a vehicle outside the car policy.
What you get with the fleet management dashboard
The principle: every module of the software feeds a tab, and every indicator is read against its target.
Overview with targets
Fleet availability, average TCO per vehicle per year, eco-driving score, regulatory compliance, vehicles off the road: five indicators, each with its objective.
Fleet status and make-up
Breakdown of named, pool and unassigned vehicles; vehicle statuses; energy mix across combustion, hybrid and electric.
Car sharing measured
Usage rate, bookings and seven-day occupancy rate of shared vehicles.
Costs and TCO trend
Cost breakdown by type and TCO trend against target, period after period; dedicated fuel, expenses and maintenance tabs.
Cost allocation and ESG sustainability
Two tabs rarely found in a fleet dashboard: costs to allocate per entity and sustainability indicators for the fleet.
Open alerts and filters
Open alerts appear in the overview; every tab can be filtered by site and by period, and exported.
How it works
- 1Import vehicles, contracts and sites. The fleet, compliance and costs are calculated as soon as the import is done, with no hardware; see fleet management.
- 2Connect what needs connecting. Telematics feeds the tab of the same name, fuel cards feed the fuel tab, entered expenses feed the expenses tab.
- 3Read, filter, export. Choose a site and a period, compare each indicator with its target, export for management or move on to the reports.
Who it is for
- SME and mid-cap leaders: a TCO per vehicle and an availability figure read in a minute (see the role page).
- Fleet managers: vehicles off the road, alerts and compliance in one place, per site (see the role page).
- Commercial fleets: named assignments, pool and car sharing followed on the same screen (see the industry page).
Your fleet on the dashboard, during the demo
A 30-minute demo: we import an extract of your fleet and read your first indicators against their targets together.
Your questions before getting started
- “Do I need a device?” No for the fleet, costs, compliance and accidents; the telematics tab and the eco-driving score require a device or a connected OEM vehicle.
- “My data is in a spreadsheet.” Importing vehicles and contracts feeds the dashboard; expenses and manual readings complete the rest.
- “How long does it take to start?” The tabs fill up as the import progresses; the overview is readable as soon as vehicles and contracts are loaded.