Multi-entity fleet cost allocation and ESG reporting
Fleet costs split by site and by period, CO2 per vehicle and the energy transition trajectory: two dashboard tabs, ready to export.
Hosted in the European Union · GDPR · Flotauto 2025 Innovation Award · free up to 50 vehicles, then €6 excl. VAT per vehicle per month
What these two tabs change
- Up to -70 % of the time spent producing reports: the views are calculated, filtered by site and exported.
- CO2 in g/km per vehicle and an energy mix of the fleet, continuously up to date.
- LOM compliance per car policy (2026, 2027, 2030) tracked before the orders, not after.
What the quarterly report costs today
- Charging back to subsidiaries means extracting leases, fuel, servicing and claims, then reallocating them by hand.
- The fleet's carbon footprint is reconstructed once a year, from invoices and estimates.
- The CSR department and the finance department work on two files that never reconcile.
What you get with Dadycar
The Dadycar dashboard has ten tabs, including Cost allocation and ESG sustainability. All of them filter by site and by period, and export.
Cost allocation by site and period
Fleet costs are split by site (subsidiary, branch, establishment) and by period, with a breakdown by cost type, ready for internal charge-back.
Average TCO per vehicle and target
The average TCO per vehicle per year is compared with the target set; its trend is followed over time.
Energy mix of the fleet
Share of combustion, hybrid and electric vehicles, and CO2 in g/km on every vehicle record, for ESG reporting based on the real fleet.
Energy transition analysis
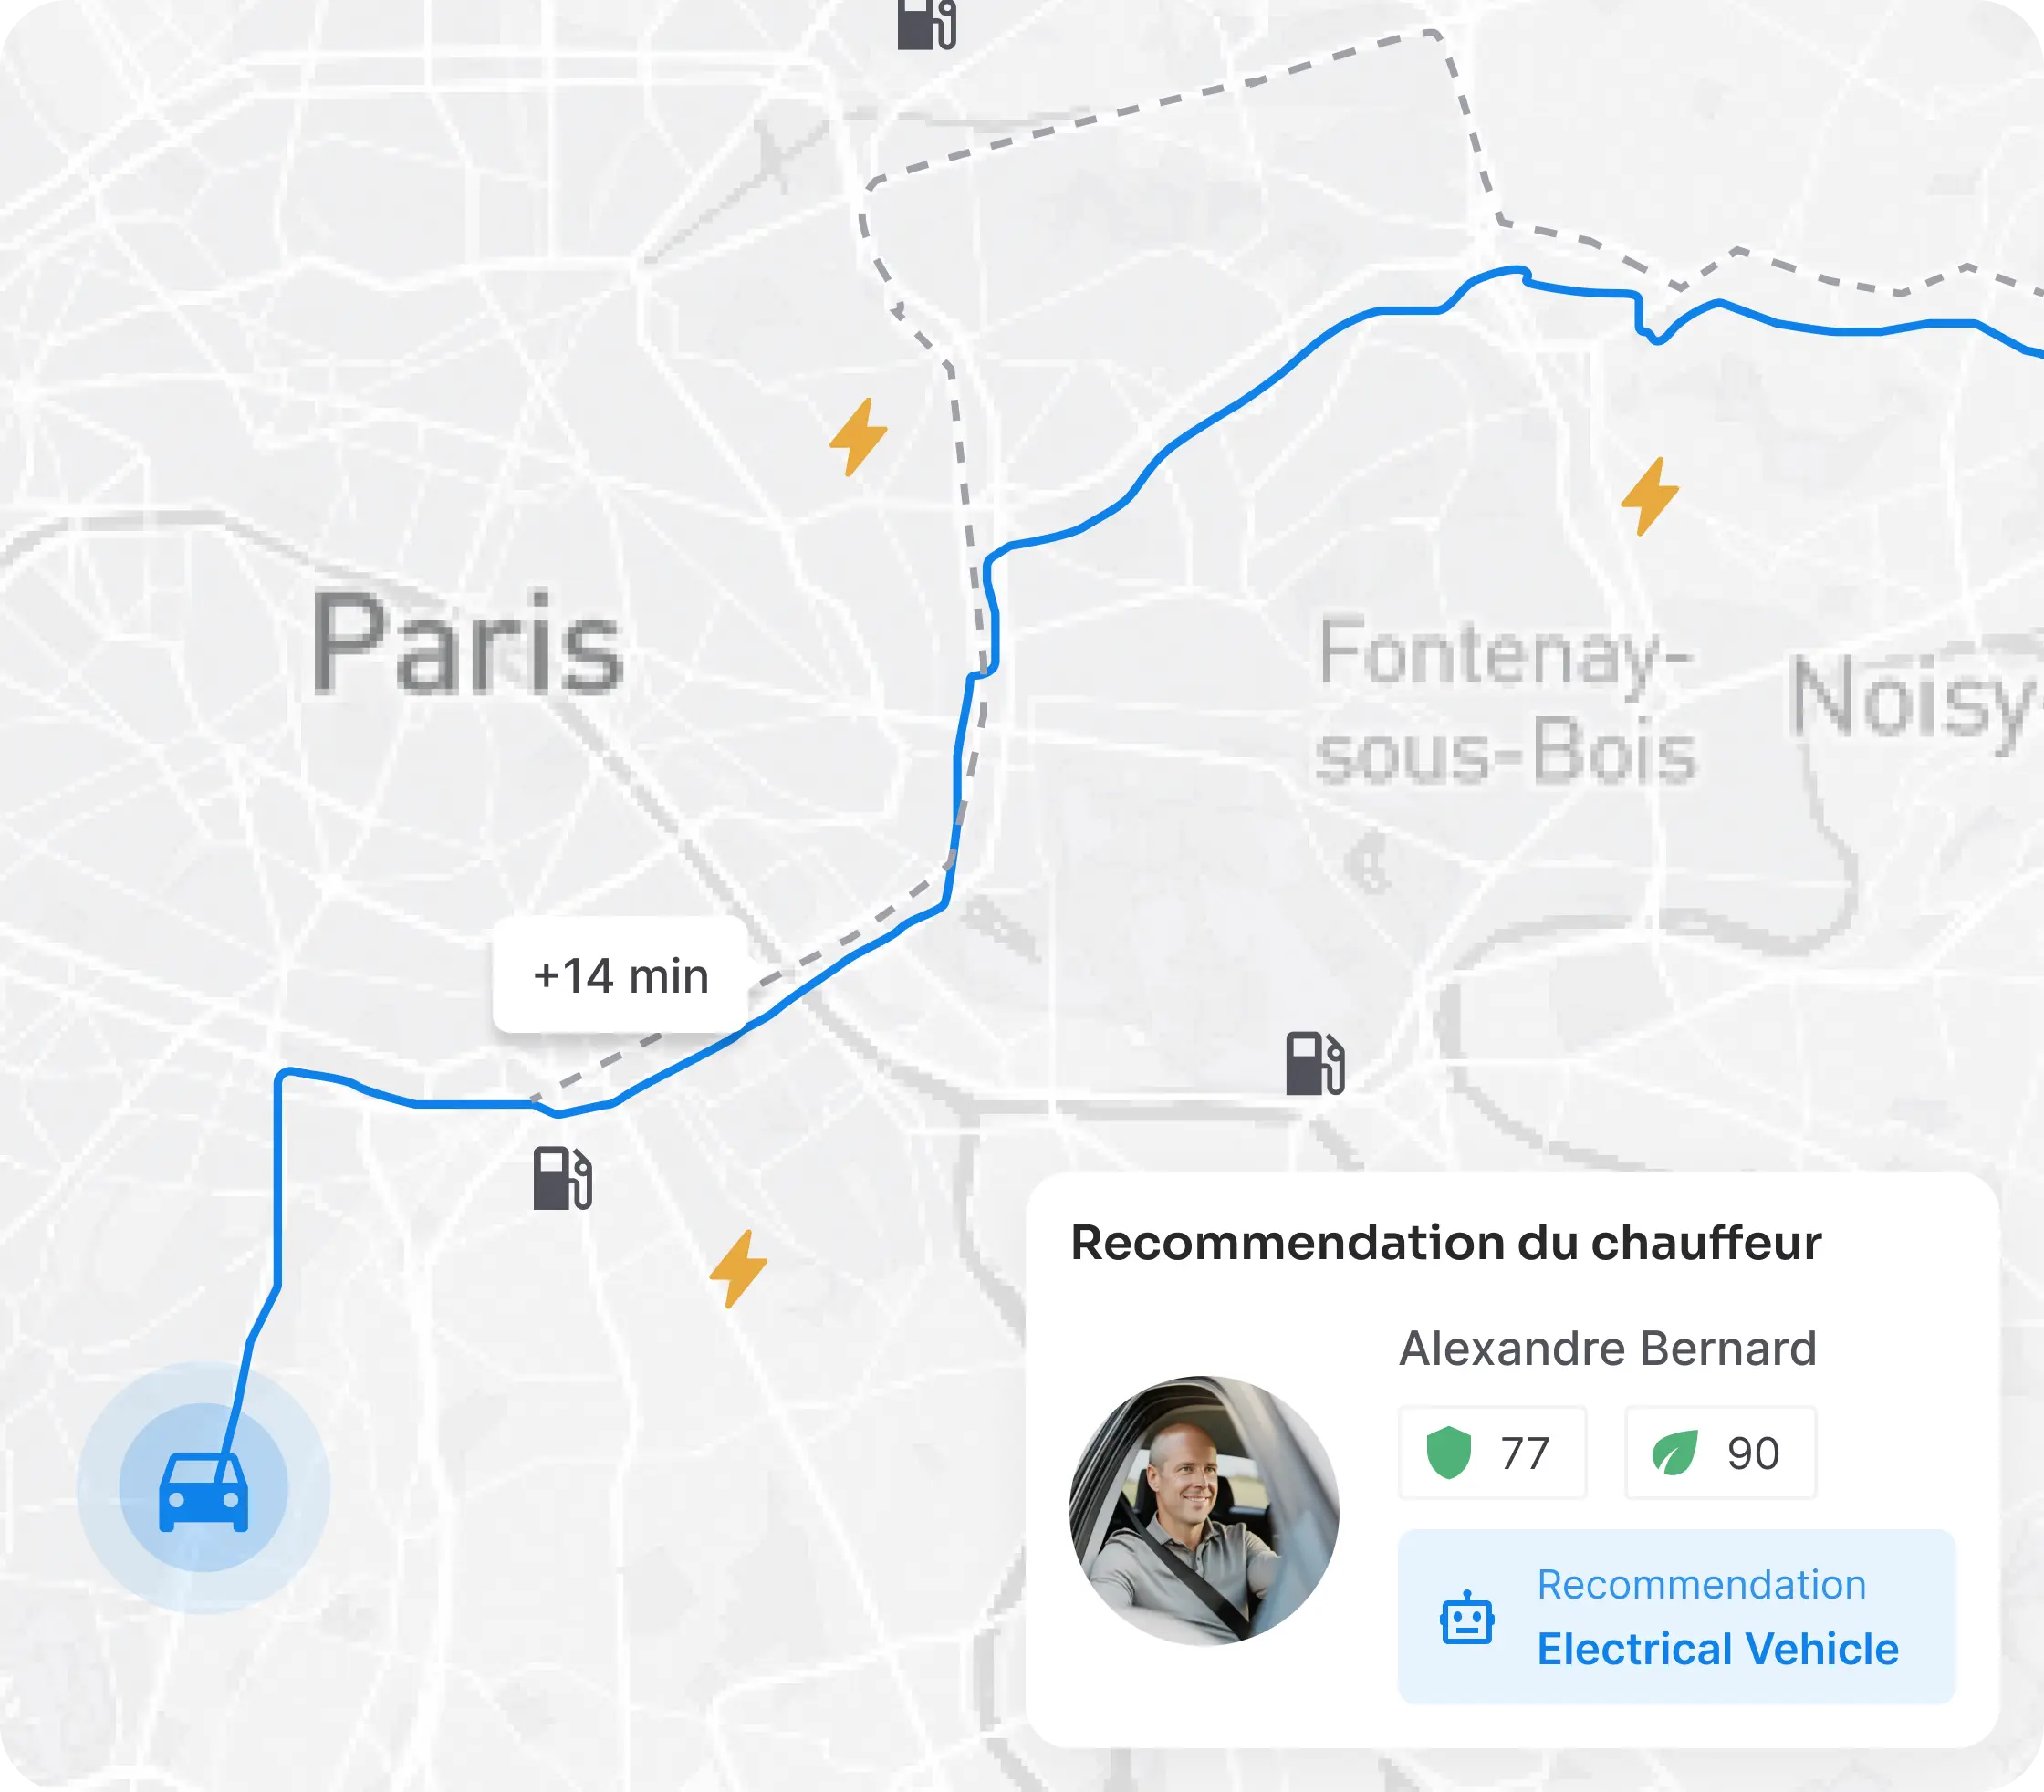
For every vehicle, an analysis of its suitability for going electric based on its usage, to build the renewal plan.
Charging and state of charge
State of charge of electric vehicles (charging, complete, low charge, not charging) and charging locations, supplier or customer.
LOM compliance per car policy
Each car policy carries a LOM compliance target for 2026, 2027 or 2030 and a maximum WLTP CO2, applied to vehicle orders.
How it works
- 1Structure your sites. Every vehicle is attached to a site; every expense, lease and claim follows the vehicle.
- 2Filter and export. Cost allocation tab for the finance department, ESG sustainability tab for the CSR department, each filtered by site and by period; the reports complete the exports.
- 3Steer the transition. The suitability analysis designates the vehicles to electrify; the car policy sets the maximum CO2 and the LOM target of the next orders.
Who it is for
- Multi-site and multi-entity groups: charge-back per establishment with no reprocessing (see the role page).
- CSR managers: energy mix and fleet CO2 for extra-financial reporting (see the energy transition solution).
- Transport and logistics: costs per branch and an electrification path for the rounds (see the industry page).
Your next charge-back, without a spreadsheet
A 30-minute demo: we load your sites and your costs, then produce together the charge-back and the ESG view of the last quarter.
Your questions before getting started
- “Our entities use different allocation keys.” The split is done by site and by period on the real costs of the vehicle; the exports then feed your accounting tool.
- “Do I need a device for ESG reporting?” No for the composition of the fleet and the CO2 per vehicle; telematics refines the electric suitability analysis with real mileage.
- “How long does it take to start?” As soon as vehicles, sites and expenses are imported, both tabs are populated.